Q.1.
A.1.(i) and (ii)
(i) Find the minimum and maximum volume using spreadsheet formula.
(ii)Create 5 classes with suitable class interval and create the frequency
distribution for volume using Array formula.

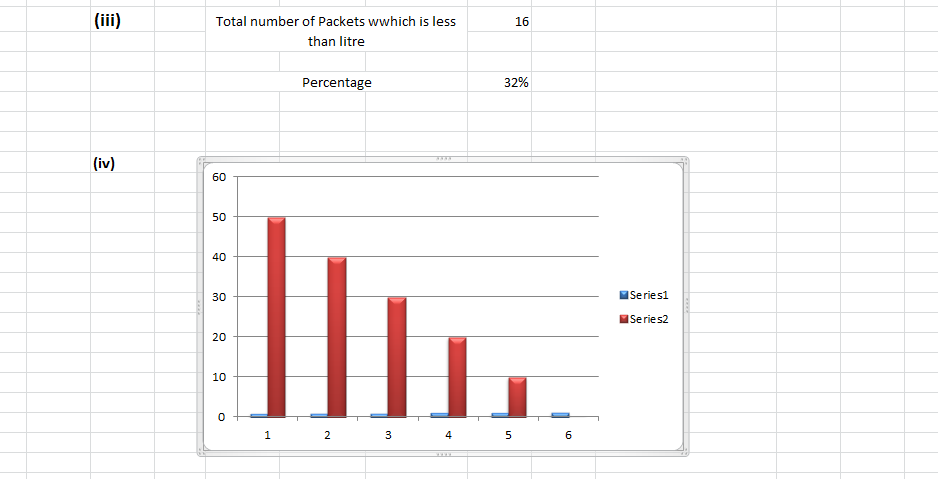
(iii) and (iv)
(iii) Find the percentage of packets having volume less than a liter.
(iv) Represent the frequency distribution with the help of a relevant
graph.
Ans:-
In statistics, a frequency distribution is a table that displays the frequency of various outcomes in a sample. Each entry in the table contains the frequency or count of the occurrences of values within a particular group or interval, and in this way, the table summarizes the distribution of values in the sample.
2. Perform the following tasks using a spreadsheet (you must either enter
necessary formula that are required to calculate the value or you may use
spreadsheet function for the same):
(i) Given a population of 5000 and a sample size of 20 with a standard
deviation of 10; calculate the standard error.
Ans
The Standard Deviation is a measure of how spread out numbers are.
Its symbol is σ (the greek letter sigma)
The formula is easy: it is the square root of the Variance. So now you ask, "What is the Variance?"
Variance
The Variance is defined as:
The average of the squared differences from the Mean.
To calculate the variance follow these steps:
- Work out the Mean (the simple average of the numbers)
- Then for each number: subtract the Mean and square the result (the squared difference).
- Then work out the average of those squared differences.

(ii) A company manufactures nails of different lengths. The nails with length 2 inch should have a mean diameter of 3 mm. A sample of 100 nails was taken out of a lot consisting of 10000 such nails. The mean sample diameter was found to be 3.01 mm having a standard deviation of 0.03 mm. Assuming a confidence level of 95%, will you accept the nail lot. Justify your answer. Make suitable assumption, if any.

.Q.3. Measure control department checked the 5 kg weights of four different
manufacturers. Four samples of each of these manufacturers were tested.
The findings are given in the following table:
Data on Five kg Weights
Sample Manufacturer
A B C D
1 5.05 5.02 5.21 4.88
2 4.99 4.97 5.15 5.01
3 5.01 4.89 5.09 4.89
4 5.03 4.87 4.93 5.00
Perform an ANOVA using any software to test (at 5% level) whether all
the four manufacturers are producing proper weights. Make suitable
assumptions, if any
Ans
Analysis of variance (ANOVA) tests the hypothesis that the means of two or more populations are equal. ANOVAs assess the importance of one or more factors by comparing the response variable means at the different factor levels. The null hypothesis states that all population means (factor level means) are equal while the alternative hypothesis states that at least one is different.
To perform an ANOVA, you must have a continuous response variable and at least one categorical factor with two or more levels. ANOVAs require data from approximately normally distributed populations with equal variances between factor levels. However, ANOVA procedures work quite well even if the normality assumption has been violated, unless one or more of the distributions are highly skewed or if the variances are quite different. Transformations of the original dataset may correct these violations.


Q.4.A Petrol filling station records the details of sales of petrol every day. The following table shows the sale of petrol by the company. Use spreadsheet software to find the moving averages for the length of 4 and 5.

Q.5. A company manufactures pipes of 1 meter diameter. The company takes five observations of the diameter of the pipe on each day. These observations are taken 5 times during a working day. Calculate the control limits for mean and range, and plot the control charts using any statistical software. Make suitable assumptions, if any. The data is given in the following table: (6 Marks) Sample Days The diameter of the pipe (meters) 1 2 3 4 5 1.003 1.007 1.010 1.009 0.995 0.990 0.997 1.050 1.049 1.055 1.033 1.035 1.000 0.929 0.915 1.103 1.001 1.000 0.979 0.955 0.973 1.045 1.025 1.022 0.999 (Please take the suitable values of d2 , d3, d4 , A2 and other variables.)

Q.6. A stationery selling company sells stationery items as per the following
table. Fit a trend using any statistical software to sales data for this
company. Make suitable assumptions.
(6 Marks)
Month Mar Arp May June Jul Aug Sept
Sales (Units) 2000 8000 4000 1000 3000 3000 4000

nice
ReplyDeleteThanks
Deletethank u for ur help
ReplyDeleteIt's my pleasure
DeleteThis comment has been removed by the author.
ReplyDeleteI’m Артур Борис a resident/citizen of the Republic Of Russian. I’m 52 years of age, an entrepreneur/businessman. I once had difficulties in financing my project/business, if not for a good friend of mine who introduced me to Mr Benjamin Lee to get a loan worth $250,000 USD from his company. When i contacted them it took just five working days to get my loan process done and transferred to my account. Even with a bad credit history, they still offer their service to you. They also offer all kinds of loan such as business loans, home loans, personal loans, car loans. I don’t know how to thank them for what they have done for me but God will reward them according to his riches in glory. If you need an urgent financial assistance contact them today via email lfdsloans@outlook.com WhatsApp information...+1-989-394-3740
ReplyDelete